|
During our technical tests on July 7th on train tracks, the onboard computer recorded data from the different sensors mounted on the train: sun irradiance, voltage and current provided by the solar panels and the position of the wheels. 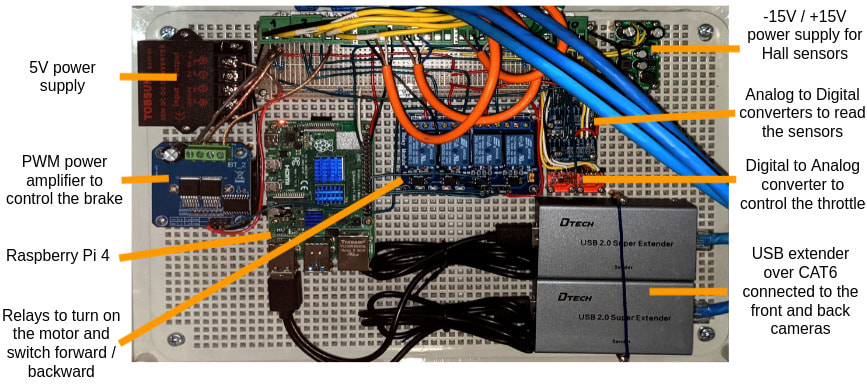 The goal was to determine:
After the tests, we downloaded the data logs and analyzed them in a spreadsheet. Solar panel efficiencyComputing the solar panel efficiency is straightforward: the sun irradiance sensor, positioned at the same angle as the panels, measures how much solar power is received on the panels and the voltage multiplied by the current gives the power the panels are generating. Monocrystalline solar panels are sensitive to the temperature: efficiency decreases with temperature rise. The panels we are using are 22.2% efficient at 25°C but lose 0.29% of efficiency for each additional degree. The peak efficiency is reached when the optimal amount of current is drawn from the panels. The optimal current depends on the sun irradiance and the panel temperature. We estimated the peak efficiency would produce around 55V. We estimated that the solar panels would warm up to 35°C so we expected their efficiency to be around 19.3%. 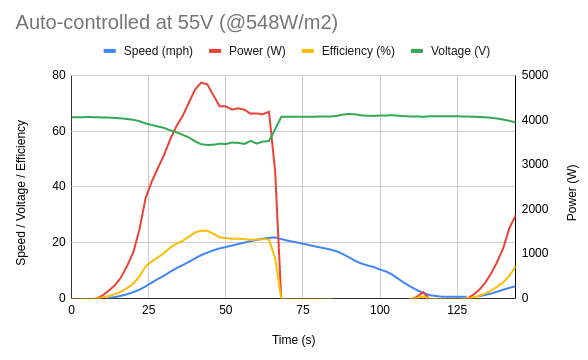 Fig 1: Graph of run #10 data Run #9 test conditions:
Based on the measurements, the efficiency of the panels is above 21% at 55V under those conditions, which is above what we expected! Rolling friction To determine the friction, we accelerated multiple times the train up to 10 mph and let it slow down to a near stop by itself. By knowing the weight of the train, we know how much energy the system has at 10 mph. The energy loss over time is due only to the friction so we can compute the friction force. 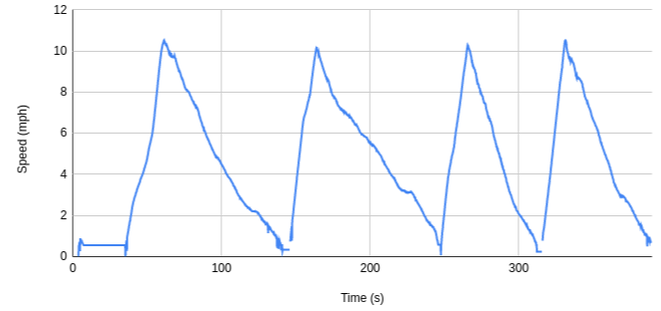 Fig 2: Graph of run #8 speed data Test conditions:
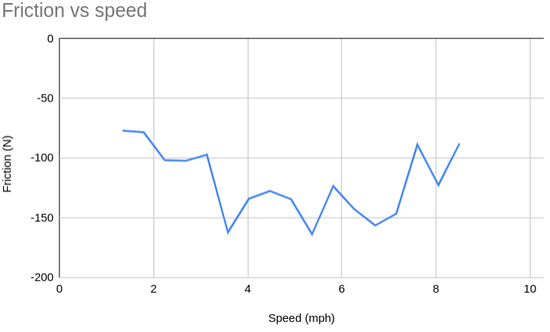 Fig 3: run #8 friction vs speed Since 10 mph is a relative low speed, we can assume that this friction is mostly created by rolling friction. The friction is, as expected, mostly constant regardless of the speed. Based on those measurements, we can assume that our rolling friction is about 125N. This is close to the double of what we expected: we expected the rolling friction to be around 70N. However during this first test, the solar train has its axle misaligned, so we expect the rolling friction to be reduced considerably now that the axles have been aligned correctly. Air friction To determine the air friction, we ran the train at a higher speed and let it slow down. 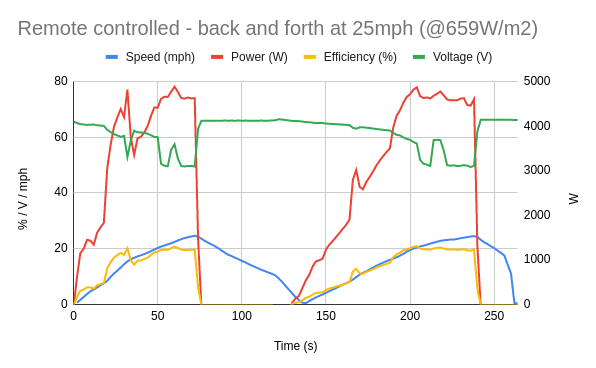 Fig 4: graph of run #9 data 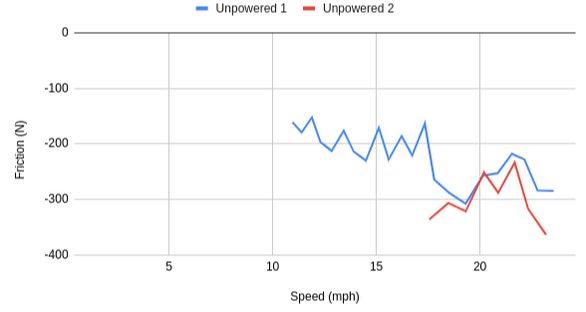 Fig 5: graph of run #9 friction We now see that the friction increases with the speed. By subtracting the rolling friction, we can deduce the air friction and compute the drag. The air friction is proportional to the square of the speed. 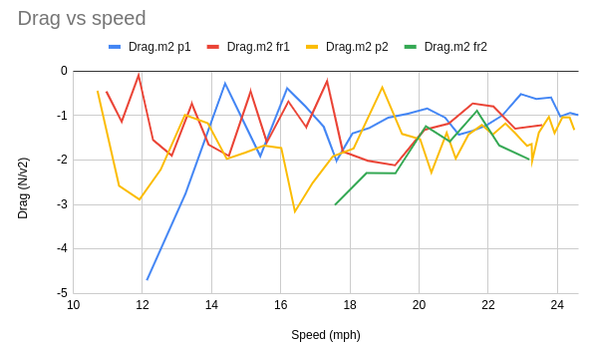 Fig 6: graph of run #9 drag By dividing the remaining friction by the square of the speed and the frontal surface, we can now see that we have a roughly constant drag coefficient independent of the speed. Based on those measurements, we have a drag coefficient around 1.5. This is quite a large drag coefficient but it was expected: the train has no aerodynamic body during this test. We expect to reduce considerably the drag coefficient after adding the body panels and we will measure the drag again during our next tests. Motor efficiency Now that the friction forces have been estimated, we can measure the motor efficiency by looking at how much electrical power we provide to the motor and how much mechanical power is generated. Our data were not accurate enough to create a graph but we estimated the electric motor to have an overall efficiency of 85%. This is less than expected, we expected above 88% but the maximum efficiency of the motor should be when it reaches 4,000 rpm (when the train runs at 65 mph) so we expected to see a higher efficiency when we test the train at a higher speed. ConclusionThanks to the data logged during the technical tests, we were able to validate that the energy consumption of our solar train is close to our prevision.
This validates our design and we won't do any major revisions following those tests. This also increases our confidence that we can reach 65 mph with the full 80' structure with an aerodynamic body. - Marco
0 Comments
Leave a Reply. |
Archives
August 2021
Categories |
 RSS Feed